Running Resolution
After configuring your identity graph, you can run identity resolution to link customer records and produce golden records. Zeotap decides between two resolution modes on every run: an incremental update (process only what changed since the last run) and a full rebuild (recompute every profile from scratch). You do not choose per run — the system does, and every run records which it did and why.
Full Resolution
Full resolution reprocesses all records from all entity types, rebuilds the entire identity graph, and recomputes all clusters and golden records from scratch.
When to Use Full Resolution
- First run — Always run full resolution the first time after creating an identity graph
- After rule changes — When you modify merge rules, limit rules, probabilistic settings or shared identifier attribution. Zeotap detects those and forces the next run full for you
- After changing which models or columns feed the graph — Attaching a model, or mapping a different column into an identifier family, is not part of that detection. Choose Rebuild from scratch yourself
- After major data changes — When a large data migration or backfill significantly changes the source data
- Periodic refresh — As a scheduled full recomputation to correct any drift from incremental resolution
How It Works
- Extract identifiers — Query all source tables to extract record keys and identifier values
- Normalize — Apply each identifier family’s normalization to every value (lowercase and hash emails, strip phone formatting, and so on) so that variants of the same identifier compare equal
- Build links — For each identifier value, link the records that share it
- Apply limit rules — Ignore identifier values shared by more records than their shared-value limit allows, and — where a family limits how many values one profile may hold — process merge rules strongest-first, declining any merge that would carry a profile past a stronger family’s limit
- Assign anonymous activity — Where two people were kept apart, give the anonymous records the shared identifier stranded to whoever your shared identifier attribution setting names
- Find connected components — Run the graph algorithm to identify clusters of linked records
- Produce golden records — Apply survivorship rules to each cluster to create unified profiles
- Materialize — Write cluster assignments and golden records to the warehouse
Rebuilding From Scratch
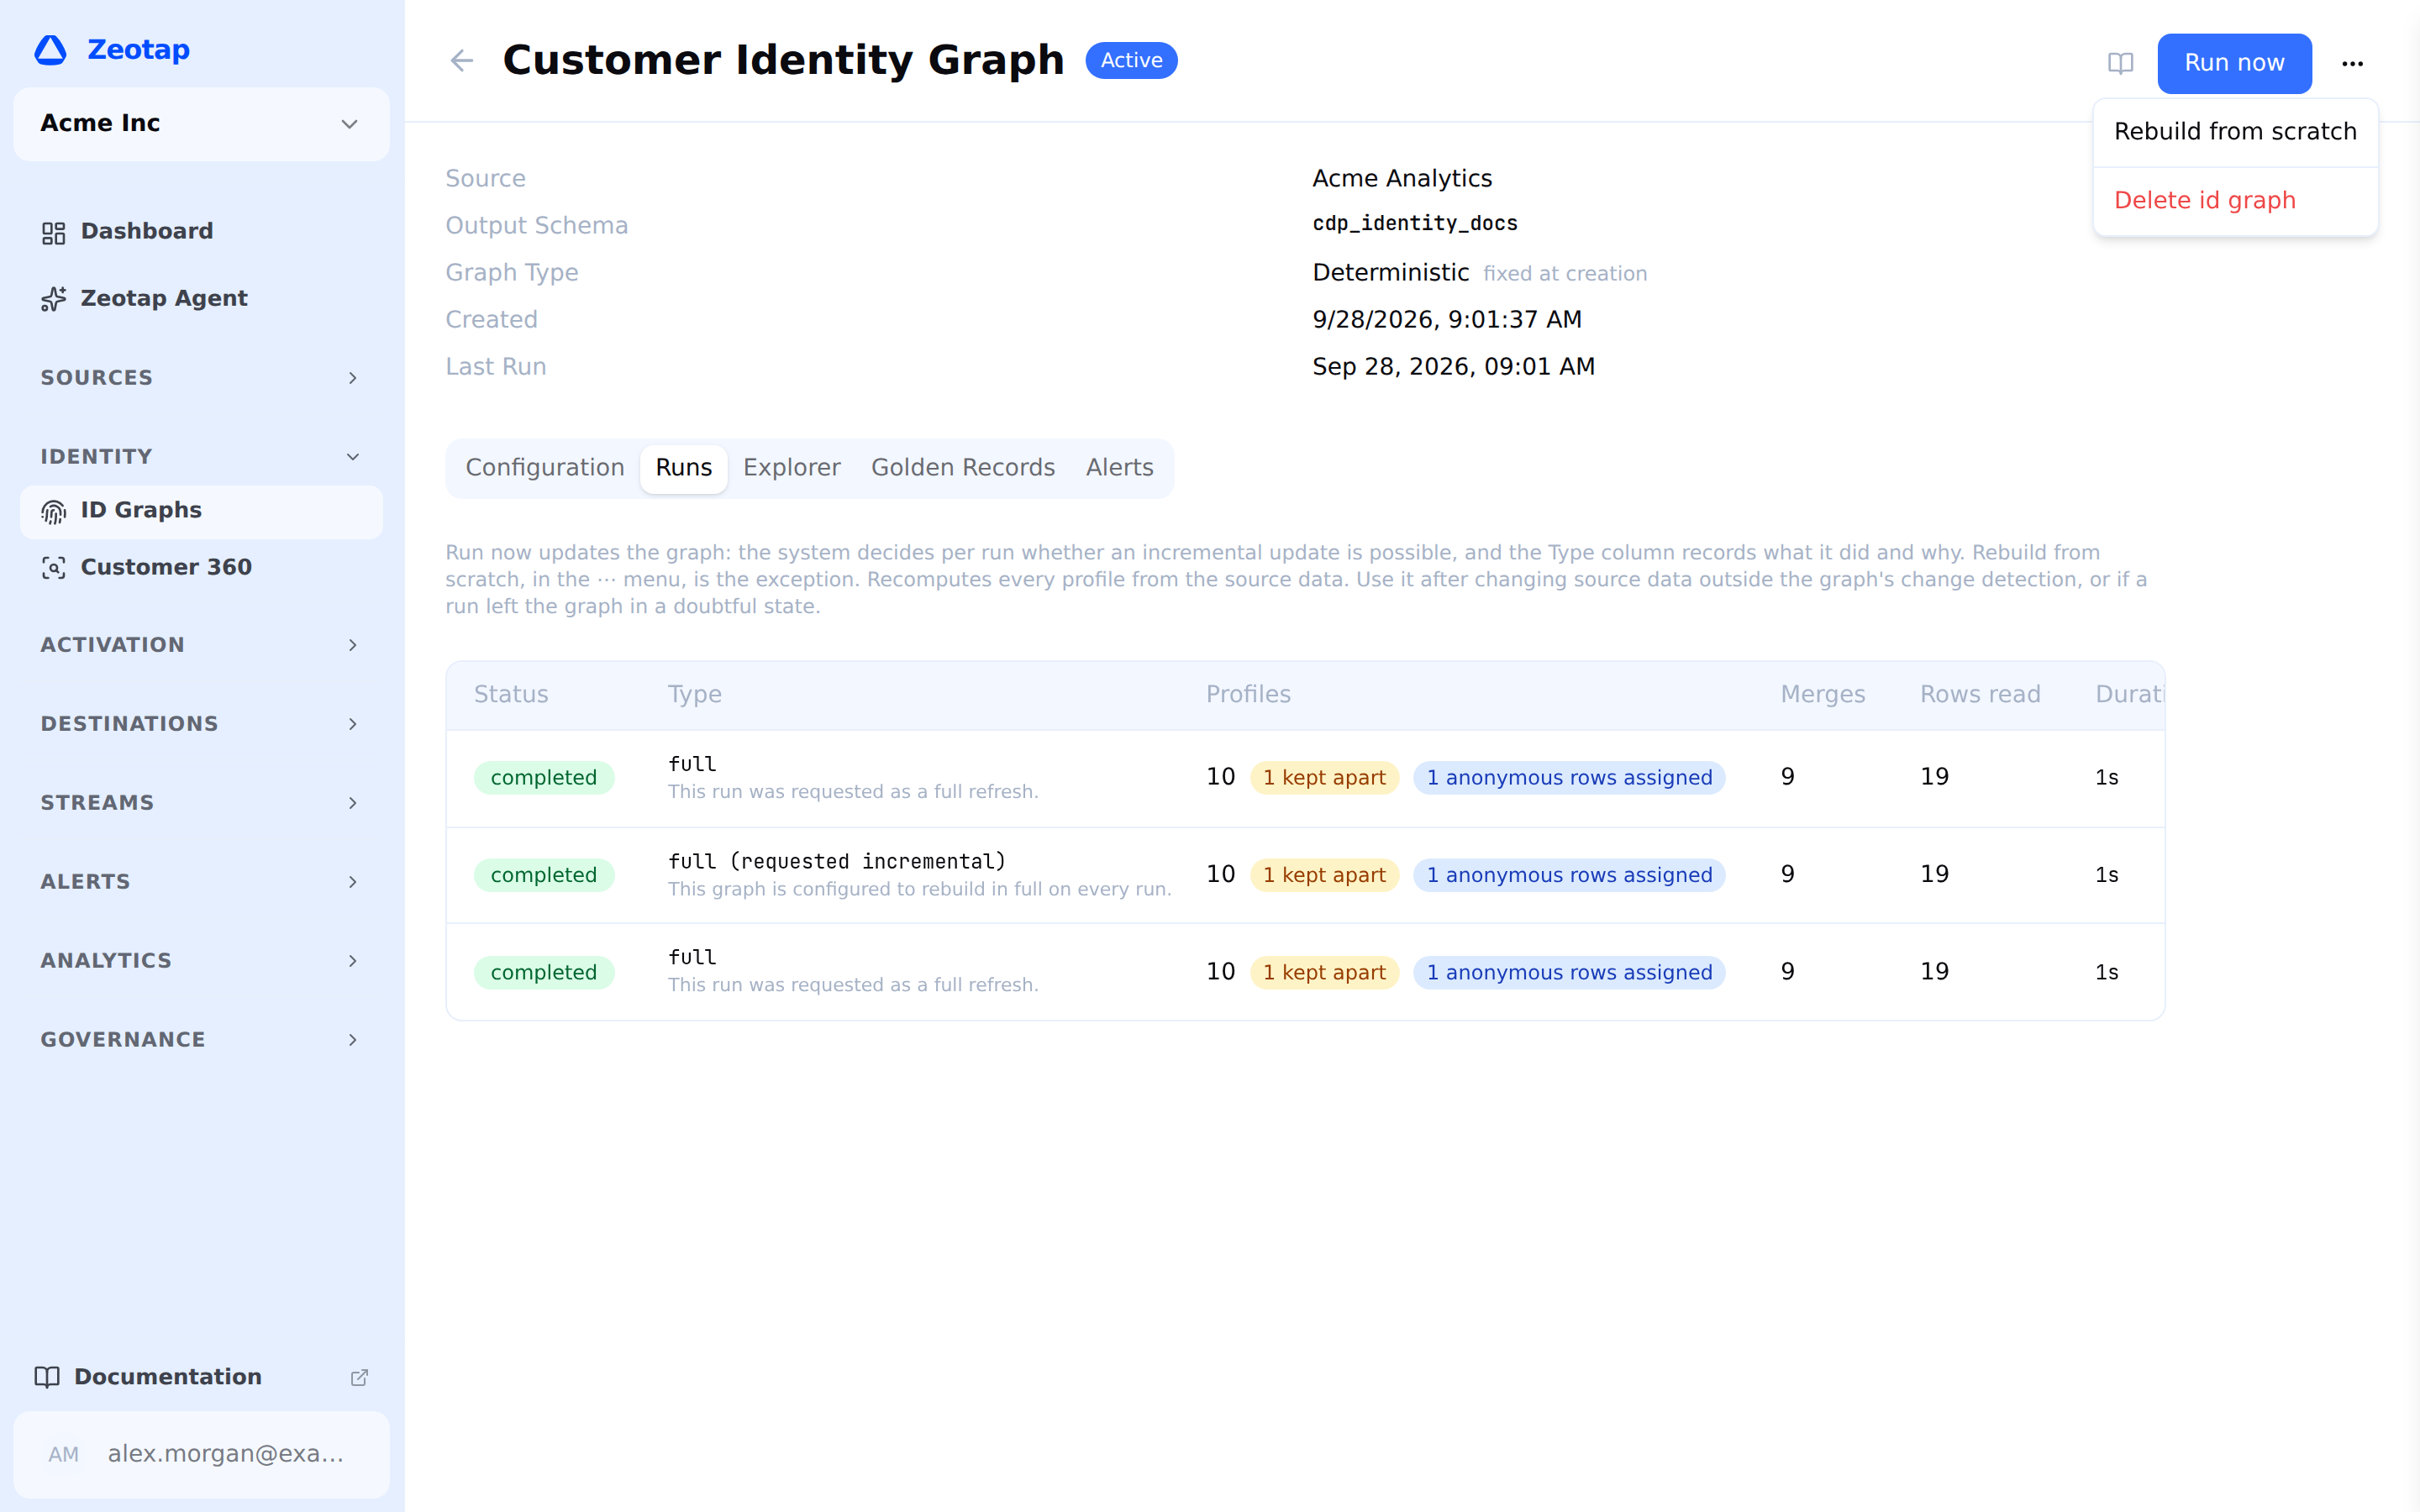
From the UI: open your identity graph and choose Rebuild from scratch from the ⋯ menu. It recomputes every profile from the source data. Use it after changing source data outside the graph’s change detection, or if a run left the graph in a doubtful state — an ordinary Run now is enough the rest of the time, and the system rebuilds from scratch on its own whenever that is the only correct answer.
From the API:
POST /api/v1/workspaces/{id}/identity-graphs/{graphId}/trigger
Content-Type: application/json

{
  "run_type": "full"
}
Performance
Every statement runs inside your warehouse, so what a run costs is warehouse compute on your own data. The factors that move it:
| Factor | Impact |
|---|---|
| Total record count | More records, more links to evaluate |
| Number of identifier families | Each enabled merge rule is its own link-building step |
| How widely values are shared | A value on many records produces many links. This is what the shared-value limit exists to bound |
| Per-profile limits | A limited graph runs one pass per priority tier instead of one link-building step, and each pass propagates and is then checked. Expect a limited graph to cost more per run than an unlimited one of the same size |
| Cluster shape | Long chains of linked records take more propagation rounds to settle than tight clusters |
| Warehouse compute | Larger warehouses process faster |
There is no useful universal benchmark for “how long a run takes at N records” — the same record count resolves in very different times depending on warehouse size, how interconnected the data is, and how many merge rules are enabled. Measure your own first full run and use it as the baseline; the run history keeps every duration.
What a Run Costs in Statements
A resolution run is a sequence of SQL statements executed against your warehouse, and on a small graph the number of statements matters more than the data any one of them touches. A run’s statement count is driven by the same things as its data volume:
| Shape | Roughly what it issues |
|---|---|
| A graph with no per-profile limit | One link-building step per enabled merge rule, then propagation until the clusters settle |
| A graph with per-profile limits | One pass per priority tier, each building links, propagating, and being checked against every limit at or above it — so the statement count grows with the number of distinct priorities, not just with the number of rules |
| A pass that kept two people apart | An extra round to identify what was kept apart, and — where that actually un-merged something — a replay of that pass. A decision that changed nothing no longer costs a replay |
| Shared identifier attribution | A further group of statements per pass, wherever the setting is not no one |
| An incremental run on a limited graph | The pass sequence again, over the reachable set rather than the whole graph |
Two properties of the engine are worth knowing when you are reading a duration.
Work is bounded to what changed. On an incremental run over a limited graph, propagation, convergence checking and the intermediate snapshots are all restricted to the reachable set rather than recomputed over the whole graph, and a day on which nothing changed finishes in a handful of statements without touching the graph at all. Output tables are swapped into place rather than copied, so rewriting a result costs no data movement.
Statements are batched where your warehouse supports it. Each statement otherwise costs a full round trip between Zeotap and your warehouse — around a second on some engines — which on a small graph can dominate the run. Where the warehouse supports multi-statement scripts, consecutive statements are sent as one script and the propagation loop runs inside the warehouse, so a run costs one round trip per decision point rather than one per statement.
This is a performance mechanism only — the SQL is identical either way. Zeotap checks once per connection whether your warehouse can run a multi-statement script and falls back to sending statements one at a time if it cannot: an engine with no scripting mode, or a role without the privilege. Nothing about the result changes, only the number of round trips. Every statement is still labelled with the step that issued it, so a failed run names the step that failed whichever mode it was in.
Incremental Resolution
Incremental resolution processes only records that have been added, modified, or deleted since the last resolution run. This is significantly faster than full resolution for ongoing operations.
When to Use Incremental Resolution
- Regular scheduled runs — After the initial full resolution, use incremental for daily/hourly updates
- Real-time data ingestion — When new records arrive continuously from loaders or event pipelines
- Cost optimization — Incremental runs consume far less warehouse compute than full runs
How It Works
- Detect changes — Identify records added or modified since the last run’s cursor, and records that have disappeared from the source
- Collect the affected identifier values — Both the value groups a changed record is joining, and the groups it is leaving. A record’s previous value is no longer in the model, so the existing links are the only record of it
- Rebuild those groups — Drop the links for every affected value and re-emit them over all current records, so the result does not depend on which record happened to arrive first
- Re-propagate — Settle the clusters again. Most clusters are untouched, so this converges quickly
- Materialize — Rewrite the cluster assignments and rebuild golden records for the profiles that changed
- Advance the cursor — Record the newest timestamp seen per model, for the next run
Graphs with a per-profile limit do more than this, because a limit makes each merge conditional on what its neighbours look like. See When a per-profile limit is set.
Change Detection
Zeotap detects changes by timestamp: each model’s timestamp column is compared against the cursor stored by the previous run, and rows at or after it are re-read.
| Requirement | Detail |
|---|---|
| A timestamp column | Set one on the model — typically updated_at or created_at. It must be updated whenever a row changes, or the change will not be seen |
| At least one model needs one | Not all of them. A model with no timestamp column is simply re-read in full on its own, while the cursor still bounds the models that have one. That is usually the right trade: the model without a timestamp is normally a small dimension table, and the one with it is the large event stream |
| A completed full run | The cursor is written by a full run. Without one, the next run is full |
Where models do have timestamp columns, keep their types compatible with each other.
A model with no timestamp column is not a problem: it contributes no timestamp, and its values sort last wherever the resolver ranks identifiers by when they were first seen — truncation and shared identifier attribution. Both then fall back to a stable, deterministic ordering, exactly as they do on a graph whose models carry no timestamps at all.
What does break is mixing types across the graph’s models: a date or datetime column in one model and a free-text column holding dates as strings in another. A date or datetime type is fine everywhere, and mixing dates with datetimes is fine. Mixing either with text is not — most warehouses reject the combination outright, and Databricks with ANSI mode off silently treats both as text, after which identifiers are ordered alphabetically rather than chronologically and 2026-1-9 sorts after 2026-10-08. Nothing fails, and the wrong identifiers are kept.
If a model stores its timestamp as text, cast it in the model’s SQL. One more consequence worth knowing where the types do mix cleanly: a DATE compares as midnight, so a value observed on the same day from a date-typed model sorts before one from a datetime-typed model whatever the actual times were.
Hard deletes are the limit of timestamp detection. A row deleted from a source table leaves no timestamped trace, so an incremental run reconciles deletes by comparing against the source directly for the models it re-reads — but a row that disappears from a model bounded by its cursor is only reclaimed at the next full run. Schedule a periodic full refresh, or prefer soft deletes with an updated timestamp.
Warehouse-native change feeds — Snowflake Streams, Delta change data feed, BigQuery change history — are not used. Timestamp comparison is the only change-detection method implemented, and it is the only one available on every supported warehouse.
Running the Graph
From the UI: open your identity graph and choose Run now. There is one button, and it does not ask which kind of run you want: the system decides per run whether an incremental update is possible and rebuilds from scratch when it is not, then records what it did and why on the Runs tab.
From the API:
POST /api/v1/workspaces/{id}/identity-graphs/{graphId}/trigger
Content-Type: application/json

{
  "run_type": "incremental"
}
The API still takes a run_type, and incremental is a request: if the conditions for an incremental update are not met, the run rebuilds from scratch and says so — see What actually ran.
When a Per-Profile Limit Is Set
Every identifier family with an enabled, exact-match merge rule carries a per-profile limit by default, so this applies to every graph created from now on unless you set those limits to 0. Graphs created before defaulting are unaffected — their families have no limit.
A limit on how many values one profile may hold makes each merge conditional on the ones around it: admitting one new record can undo a decision an earlier run made — a cookie that linked nobody last night because it spanned two emails has to link again the moment one of those emails is corrected — and a plain list of changed records does not say so.
So a limited graph does not resolve only what changed. It resolves everything reachable from what changed: any record sharing an identifier value with a changed record, any record already resolved into the same profile, and any record carrying an identifier a previous run set aside. It then re-applies the whole strongest-first rule sequence over that set, exactly as a full rebuild would.
Two things follow.
- These runs cost more than an incremental update on a graph with no per-profile limit of the same size, because the set recomputed is larger than the set that changed. They are still far cheaper than a full rebuild for an ordinary day’s changes.
- Some of them become full rebuilds. When the reachable set will not settle, or grows past half the graph, rebuilding everything is cheaper and Zeotap does that instead. The run then reports the change reached more than half the graph as its reason.
A graph that rebuilds from scratch on most runs is describing its data, not a misconfiguration: it usually means one very widely shared identifier links most of the graph together. A shared-value limit on that family is the fix.
Limitations of Incremental Resolution
- Drift accumulation — Over many incremental runs, small inaccuracies can accumulate. Schedule periodic full runs to correct this.
- Hard deletes may be missed — A row deleted from a source table leaves no timestamped trace. Prefer soft deletes with an updated timestamp, or schedule periodic full runs.
- Rule changes — If you modify merge rules, limit rules, probabilistic settings or shared identifier attribution, the graph must be rebuilt from scratch for the change to take effect across all records. Zeotap detects this and does it on the next run for you. Changing which models or columns feed the graph is not detected — choose Rebuild from scratch after that yourself.
- Probabilistic graphs always rebuild in full — Fuzzy matching scores a record against the whole population, not against a changed subset, so it cannot be recomputed from a delta.
Scheduling
Set the graph’s Schedule on its Configuration tab. It is the same control the rest of the product uses, with three modes:
| Mode | What it means |
|---|---|
| Manual | No automatic runs. Use Run now when you want one |
| Recurring | Every N minutes, hours or days, or weekly or monthly, with a time of day and a timezone |
| Custom cron | A five-field cron expression, for timing the builder cannot express |
The schedule decides when a run happens. What it does — an incremental update or a full rebuild — is the system’s decision, taken per run. A daily schedule therefore already gives you the pattern operators used to build by hand: incremental updates most days, and a rebuild from scratch whenever one is needed.
Two settings shape that decision, and both are chosen when you create the graph, under Advanced on the wizard’s review step:
| Setting | Options | Default |
|---|---|---|
| Run mode | Automatic — decide per run whether an incremental update is possible, and fall back to a full rebuild when it is not. Full — every run recomputes the whole graph from its source models | Automatic |
| Full rebuild every | On Automatic only: rebuild from scratch after this many runs, so a graph cannot drift indefinitely from a clean rebuild | 10 runs |
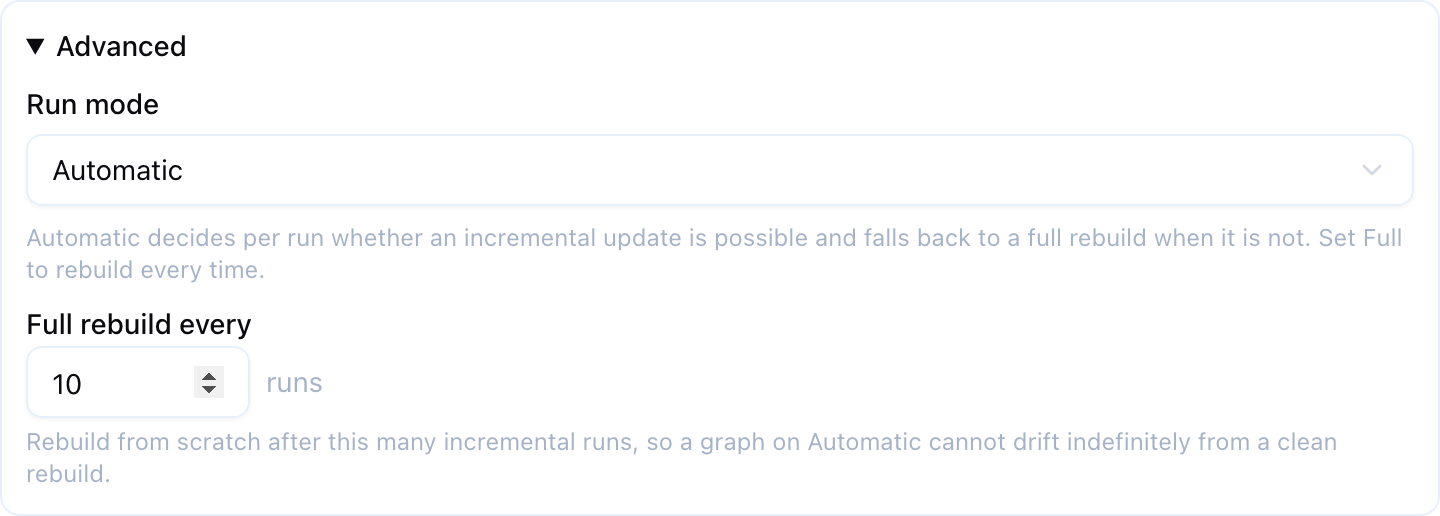
Neither appears on the Configuration tab of an existing graph — to change them afterwards, use the update endpoint’s incremental_mode and full_refresh_every fields. incremental_mode also accepts timestamp, which behaves as Automatic does, and hash, which is accepted but not implemented: a graph set to hash rebuilds in full on every run, reporting this graph is configured to rebuild in full on every run.
Monitoring
Resolution Run Status
Each resolution run has a status:
| Status | Description |
|---|---|
| Pending | The run has been created but has not started |
| Running | The resolution is in progress |
| Completed | The resolution finished successfully |
| Failed | The resolution encountered an error |
| Cancelled | You cancelled the run from the Runs tab |
A run that is still pending or running carries a Cancel control at the end of its row.
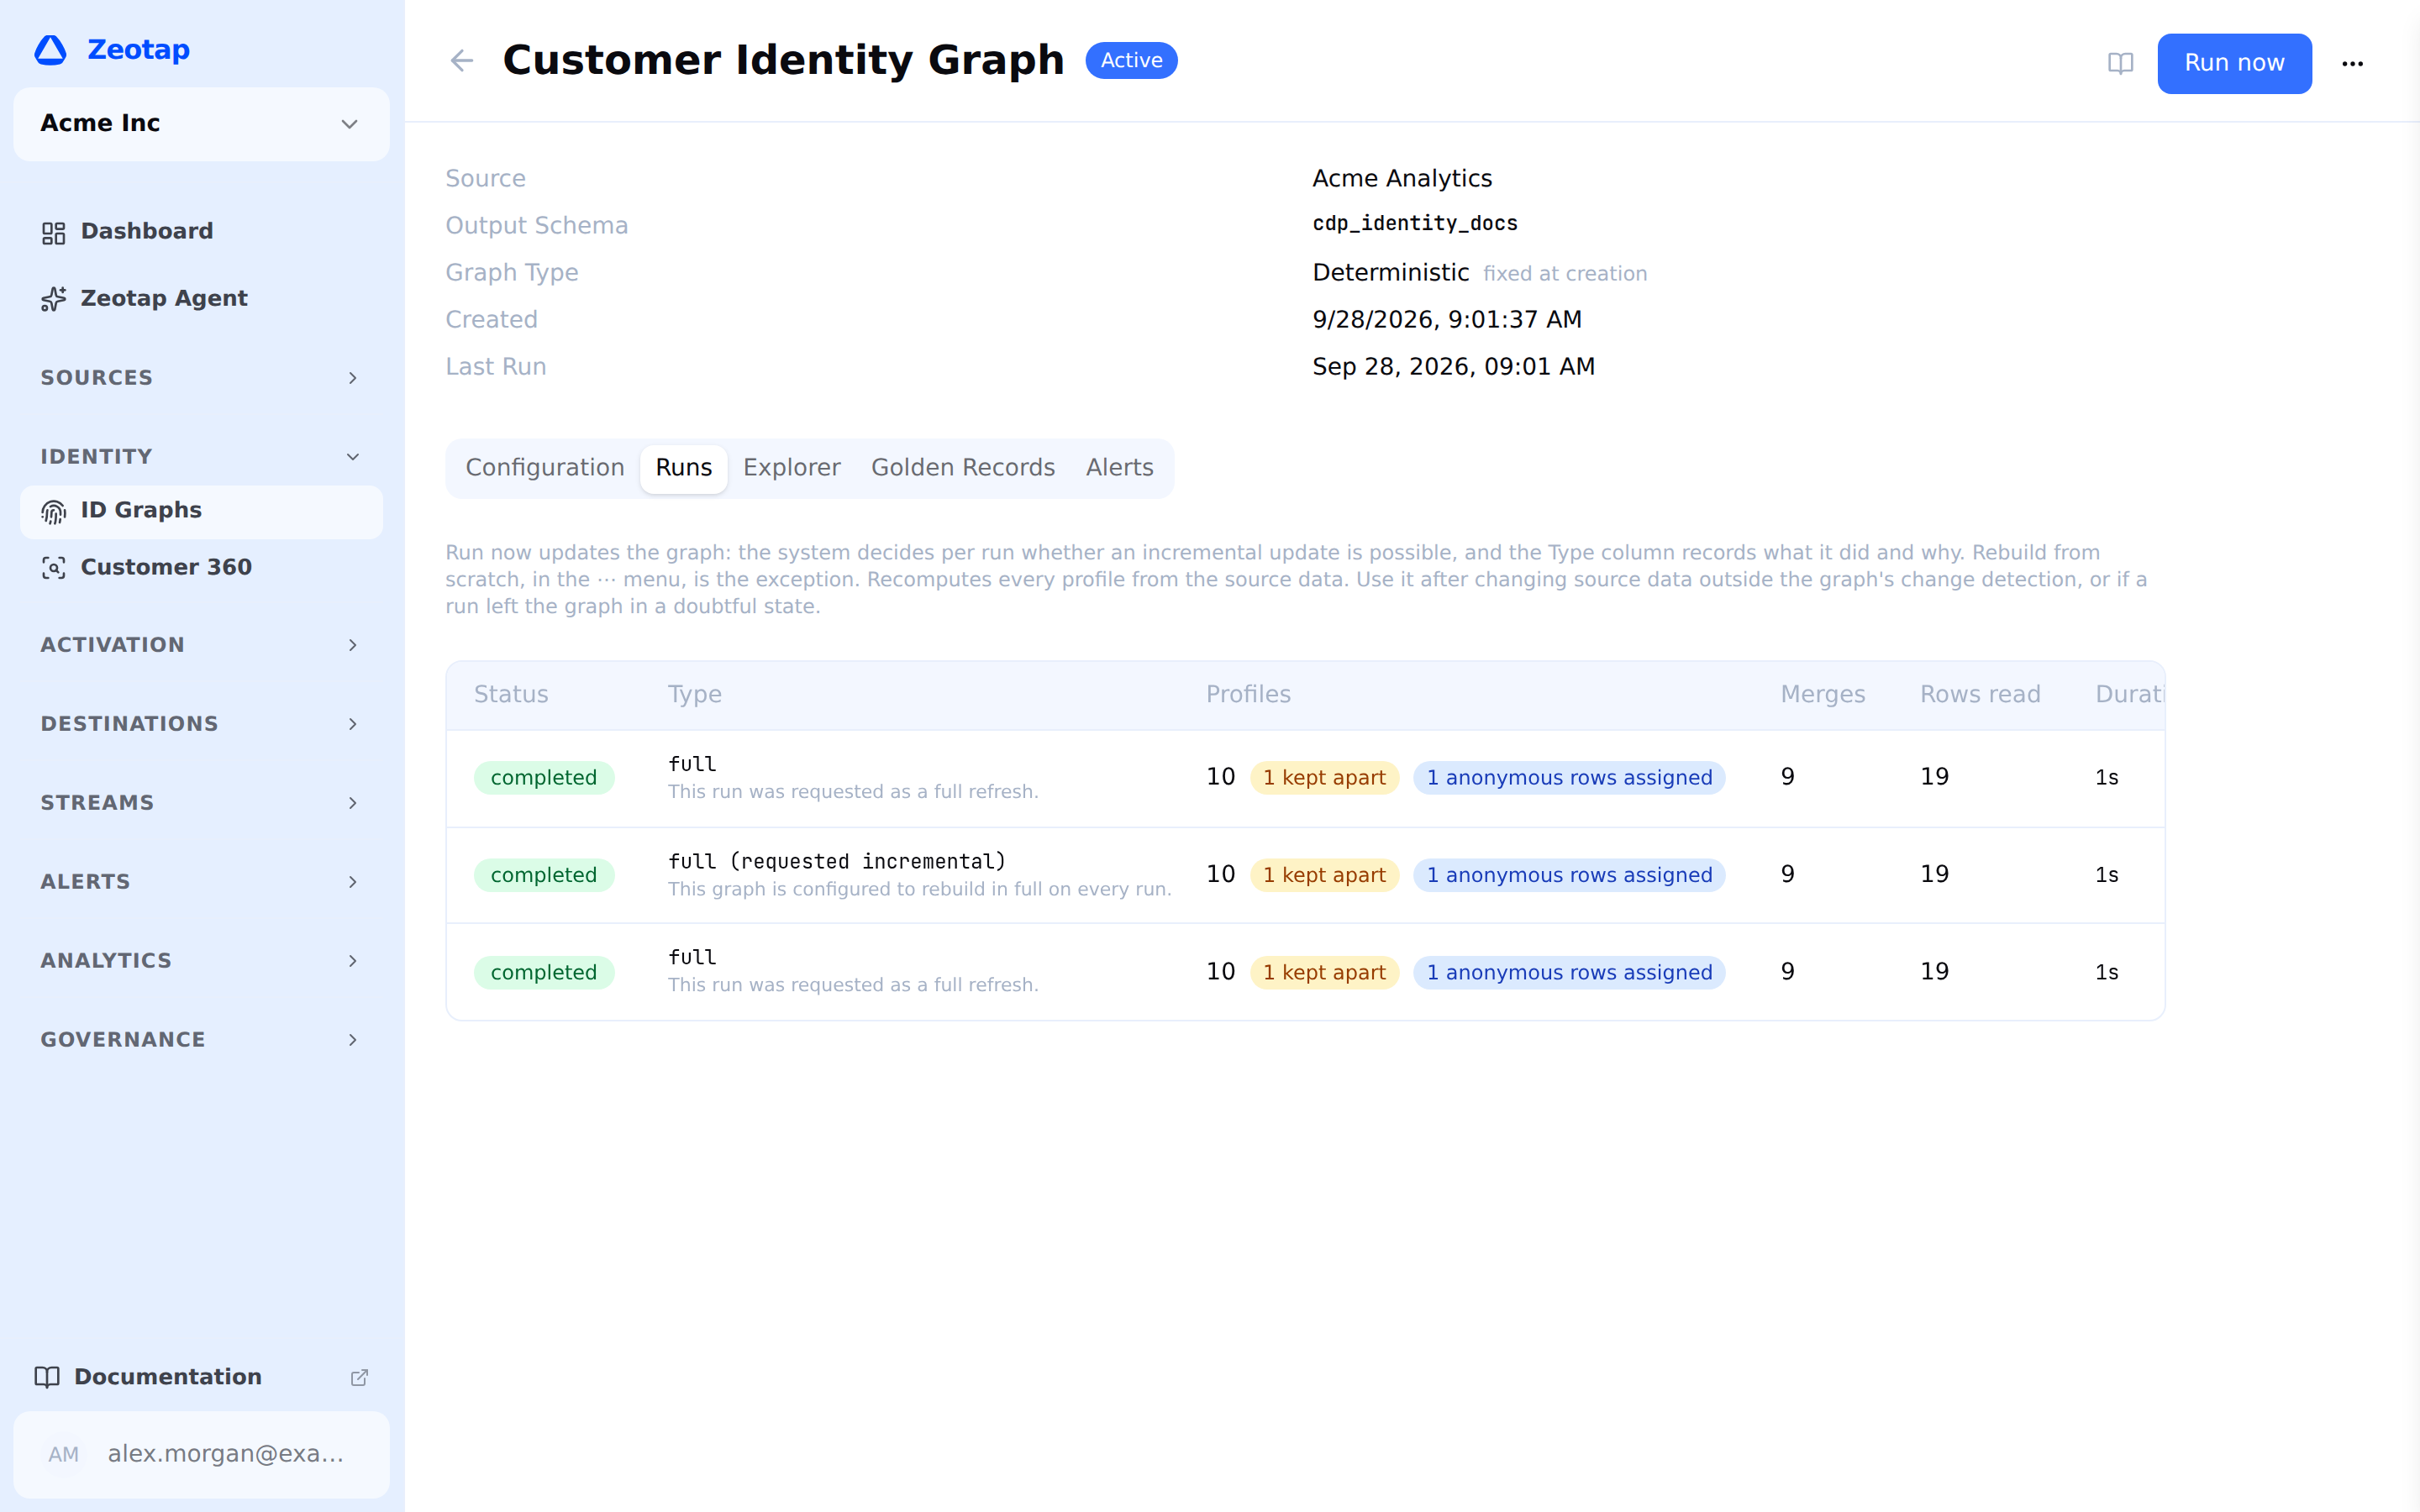
The Runs tab lists every run the graph has made, newest first.
Run Metrics
Each run row on the Runs tab carries exactly these columns. There are no others on screen — anything else you want about the shape of the resolved graph is a query against the output tables in your own warehouse.
| Column | Description |
|---|---|
| Status | Pending, running, completed, failed or cancelled |
| Type | What actually ran — full or incremental — with the reason spelled out beneath it when that differs from what was requested. See What actually ran |
| Profiles | Total distinct profiles after resolution. Two badges can appear beside this number, and only when they are above zero — see below |
| Merges | Source records folded into another record’s profile — the graph’s rows minus its profiles. This is the figure that says whether resolution did anything. A run that published no graph, and every run recorded before this metric existed, shows — rather than a fabricated zero |
| Rows read | Source records the run resolved. On an incremental update of a graph with a per-profile limit this is the reachable set the run recomputed, not the whole graph |
| Duration | Wall-clock time, from start to whichever terminal state the run reached |
| Started | When the run began |
| Error | The failure message, when the run failed. Click it to read the whole message |

The two badges beside Profiles:
| Badge | Description |
|---|---|
| N kept apart | Distinct identifier values that would have joined two profiles, where a per-profile limit kept them separate |
| N anonymous rows assigned | Anonymous records the run gave to a profile under shared identifier attribution. Zero on no one, and zero on any graph with no per-profile limit — with nobody kept apart there is nothing to assign |
Kept apart and anonymous rows assigned are the two halves of what the shared-identifier guard did: how many values could not join two people, and how much of the stranded activity found a home rather than staying anonymous. The first counts values, because a value is the thing you can act on; the second counts records, because that is what you can reconcile against a profile’s record count.
What Actually Ran
Run now asks for an incremental update; nine conditions turn it into a full rebuild, and until this was recorded the only visible sign was that an “incremental” run took as long as a full one.
Every run therefore records what it actually executed, alongside what was requested, together with the reason when the two differ. The Runs tab’s Type column reads full (requested incremental) in that case, with the reason as plain text beneath it. When the two agree, it shows the one word.
| Reason as shown | What it means |
|---|---|
| This run was requested as a full refresh | You chose Rebuild from scratch |
| This graph is configured to rebuild in full on every run | The graph’s run mode is Full |
| This is the graph’s first run, so there was nothing to build on | No run had ever completed |
| No incremental cursor had been recorded yet, so there was no point to read changes from | The graph’s change-detection cursors are missing — usually after a reset |
| The graph’s scheduled full-refresh interval came due | Full rebuild every N runs was reached |
| No model in this graph has a timestamp column, so changed rows cannot be identified | Not one attached model carries a timestamp column |
| This graph uses probabilistic matching, which is scored across the whole graph rather than a changed subset | The graph is probabilistic |
| The graph’s resolution rules changed since the last run, so earlier results could not be reused | Merge rules, limit rules, probabilistic settings or shared identifier attribution changed |
| The change reached more than half the graph, so rebuilding everything was the cheaper path | The reachable set grew past half the graph, or would not settle |
| The incremental attempt failed and the run was completed as a full rebuild | A warehouse fault, a missing table. The error itself is in the run’s failure message |
Two properties are worth knowing:
- The decision is recorded before the run starts, not when it finishes. A run that fails after three hours still tells you what it was attempting and why — which is exactly the run where you most need to know. The one exception is Incremental failed, which cannot be known in advance: it is stamped over the earlier “incremental” at the moment that claim stops being true.
- Runs from before this was introduced show no executed type. An empty value means “not recorded”, not “unknown mode”.
Kept Apart
If any identifier family limits how many values one profile may hold, a run that had to keep two people apart carries a kept apart badge in the run history, counting them. It is the number of distinct identifier values that would have joined two profiles, where doing so would have carried one profile past a stronger family’s limit — most often a device or cookie seen with two different people’s email addresses.
The count is of values, not links, because a value is the thing you can act on.
Graphs with no per-profile limit never show this metric; there is nothing to keep apart.
A steady, non-zero count is normal. Shared tablets, family phones and office kiosks are real, and each one contributes to this number every run. What matters is the trend, not the absolute number.
| What you see | What it usually means | What to do |
|---|---|---|
| A small count, stable run to run | Genuine shared devices | Nothing. This is the limit doing its job |
| A large count that appeared suddenly | A rule change — you raised a weak family’s priority above a limited one, or added a per-profile limit | Compare profile counts before and after. If profiles fragmented more than you expected, revisit the priority order |
| A large count on a graph you have not changed | A placeholder value has entered the weak family, or a device id is being reused across users at the source | Inspect those values in the warehouse and trace one back to its records |
| A large count together with a large jump in single-record profiles | A per-profile limit is too tight for your data | Raise it, or move the limit to a stronger family |
Runs that kept nothing apart show no badge at all — a permanent “0 kept apart” column would read as a failure count on every healthy run.
Every one is recorded in your warehouse, in _IDENTITY_REJECTED_EDGES, with the identifier value, the family whose limit applied and its limit, whether the conflict was direct or arrived through a chain of other merges, the merge rule priority the decision was taken at, and where the anonymous activity was sent. Like the link table, it is rebuilt by every run and describes the latest one.
That same table also holds the values a shared-value limit ignored, marked as such — see what happens to a value that cannot link. Those are not part of kept apart: an ignored value never proposed a merge for the resolver to decline, so counting it would inflate a number operators watch for the trend. Expect the recorded rows to outnumber the badge on a graph where a shared-value limit is doing work. The Profiles page reads that table back for one customer, under Kept apart. See Limit Rules for what this does — and does not do — to the underlying records.
The table exists on every graph, so a query against it always finds something to read. It is only ever written by a graph that carries a per-profile limit somewhere: without one no merge is ever declined, and there is nothing to record.
Anonymous Rows Assigned
Where shared identifier attribution names a person rather than no one, the run also reports how many anonymous records it gave to a profile.
A count that tracks the kept apart count is normal and healthy: each shared device contributes one and some quantity of anonymous browsing to re-home. Reading the two together is the point.
| What you see | What it usually means |
|---|---|
| Kept apart above zero, nothing assigned | Either attribution is set to no one, or those identifiers carried no anonymous records at all — every record on them was already identified |
| Assigned rows rising sharply with no rule change | More anonymous traffic on already-shared devices, or a new source of cookie-only records |
| Rows assigned on a graph where they should not be | Check the attribution setting. no one is the conservative choice where anonymous activity must never be credited to a named individual |
Error Handling
When a resolution run fails, the run row carries the failure message, and that message leads with the step and statement that failed — ensure_schema, build_labels, build_edges, propagate_iter_3 and so on — before the warehouse’s own error. Click the message in the Error column to read it in full. That is usually enough to tell a credentials problem from a query timeout without opening the warehouse.
There are no partial results to inspect. Output tables are rewritten as a unit at the end of a run, so a failed run leaves the previous run’s output in place and readable. Fix the cause and re-run.
Common failure causes:
| Cause | Resolution |
|---|---|
| Warehouse timeout | Increase warehouse timeout settings or scale up compute |
| Permission denied | Check the source connection’s credentials and its grants on the output schema |
| Schema change | A source table or column was altered or removed. Update the model and the identifier mappings |
| A run stuck in Running | Runs report liveness continuously; one whose worker dies is failed automatically rather than blocking the graph forever. You can also cancel a run yourself, which aborts the query in the warehouse rather than letting it keep burning compute |
Next Steps
- Golden Records — Configure survivorship rules for unified profiles
- Profiles — Inspect one customer, including what was kept apart from them
- Profile Explorer — Search and view resolved profiles
- Creating an Identity Graph — Configure or reconfigure your identity graph