External Export (OTLP)
Export Zeotap’s operational telemetry to any OpenTelemetry-compatible monitoring platform. Configure it once and Zeotap streams metrics, logs, and traces over OTLP to New Relic, Datadog, Grafana Cloud, Honeycomb, or a generic OTLP collector — so your pipeline health sits alongside the rest of your infrastructure in the tools your team already uses.
Export is vendor-neutral: one integration, many backends. Switching platforms is a configuration change, not a re-integration.
Prerequisites
- An account with an OpenTelemetry-compatible platform (New Relic, Datadog, Grafana Cloud, Honeycomb, or any OTLP collector)
- An ingest API key (or equivalent header) from that platform
- The
observability.writepermission in your workspace
What Gets Exported
You choose which signals to export. Any combination of the three is supported:
| Signal | Contents |
|---|---|
| Metrics | Run completed and failed counts, run duration, rows processed, delivery failures, and contract violations |
| Logs | A log record for each failure |
| Traces | A span per run, named <resource type> run |
The metric instruments are:
| Metric | Type |
|---|---|
zeotap.run.completed | Counter |
zeotap.run.failed | Counter |
zeotap.run.duration_ms | Histogram |
zeotap.run.rows | Counter |
zeotap.event.delivery_failed | Counter |
zeotap.contract.violation | Counter |
Every export carries the resource attribute zeotap.workspace.id, so Zeotap telemetry filters and groups cleanly alongside your other services. Each data point also carries event_type, resource_type, severity and, where the event has them, resource_id and status.
Configuring an Export
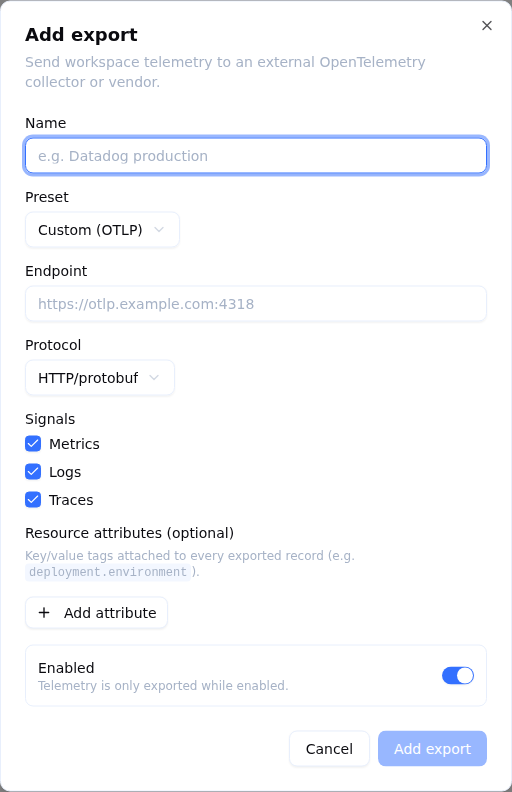
Navigate to Settings → Observability.
- Choose a preset. Selecting a platform preset (New Relic US, New Relic EU, Datadog, Grafana Cloud, Honeycomb, or Generic OTLP) pre-fills the endpoint and transport protocol for that platform.
- Name the export. Give it a recognizable name.
- Enter the API key. Paste the ingest API key (or other required header) from your platform. This value is stored securely and is never shown again — leave it blank when editing later to keep the stored value.
- Adjust the endpoint if needed. The preset fills in a default endpoint; override it if your platform account uses a different one.
- Choose which signals to export. Select any of metrics, logs, and traces (all are selected by default).
- Test the connection. Use Test to confirm Zeotap can reach your platform with the credentials you entered before relying on the export.
- Save.
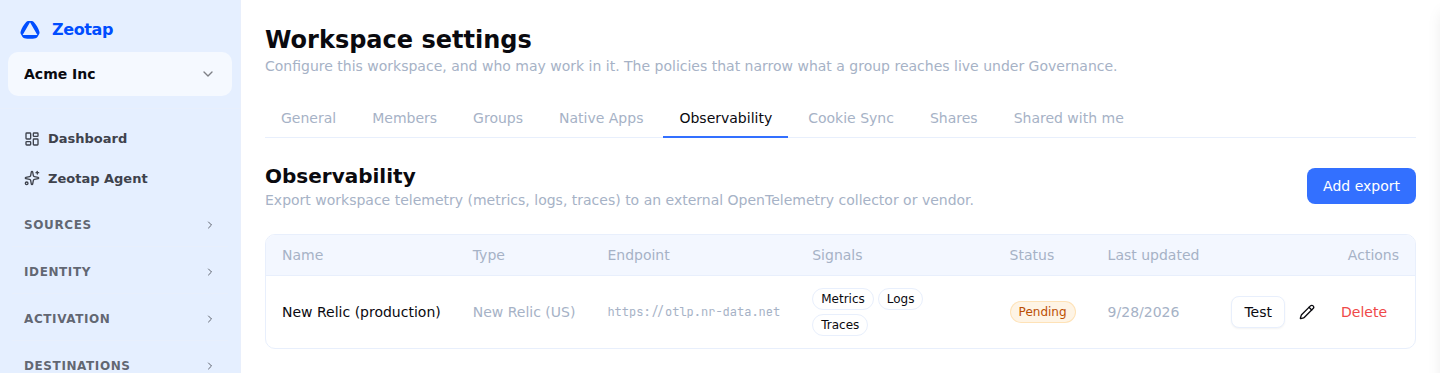
Once saved and enabled, Zeotap begins streaming the selected signals. Each export shows a status (Active, Pending, Error, or Disabled); an export in an error state shows the reason so you can correct the configuration.
Each saved export is listed with its preset, endpoint, the signals it carries and its status:
Configuration Fields
| Field | Description |
|---|---|
| Name | A recognizable label for the export |
| Preset | The target platform; pre-fills endpoint and protocol |
| Endpoint | The OTLP endpoint telemetry is sent to |
| Protocol | Transport protocol — HTTP/protobuf or gRPC |
| API key / headers | The secret credential for your platform (write-only — never returned after saving) |
| Signals | Which of metrics, logs, and traces to export |
| Resource attributes | Optional key/value tags attached to every exported record, such as deployment.environment |
| Enabled | Telemetry is exported only while this is on |
Supported Platforms
Every preset sends OTLP over HTTP and pre-fills the credential header your platform expects.
| Preset | Default endpoint | Credential header |
|---|---|---|
| New Relic (US) | https://otlp.nr-data.net | api-key |
| New Relic (EU) | https://otlp.eu01.nr-data.net | api-key |
| Datadog | https://otlp.datadoghq.com | dd-api-key |
| Grafana Cloud | your stack’s own endpoint | Authorization |
| Honeycomb | https://api.honeycomb.io | x-honeycomb-team |
| Generic OTLP | your collector’s endpoint | whatever your collector requires |
| Custom (OTLP) | your own endpoint | whatever your endpoint requires |
Grafana Cloud and Generic OTLP have no default endpoint, because each account or collector has its own — supply yours. The endpoint and headers a preset fills in are editable in every case.
New Relic has a full walkthrough at New Relic Setup.
Best Practices
- Test before you rely on it — Always run the connection test after entering credentials.
- Export all three signals — Metrics, logs, and traces are complementary; together they give the fullest picture of pipeline health.
- Use the workspace tag — Filter Zeotap telemetry in your platform by the workspace identifier to keep it separate from your other services.
- Rotate keys through the edit form — When your platform key changes, edit the export and paste the new value; leaving the field blank keeps the existing key.
Next Steps
- New Relic Setup — A full walkthrough for New Relic
- In-Warehouse Log — Keep a queryable history in your warehouse
- Alerting — Real-time notifications from the same event stream