Observability
Observability gives you full visibility into the operational health of your Zeotap workspace — every sync, journey, loader, store feed, realtime audience rebuild, identity graph run, and trait evaluation, whether it succeeded or failed.
Behind the scenes, Zeotap records a single stream of observability events: one record for each operational outcome across the platform. That stream feeds three independent sinks, so the same signal can be inspected in SQL, drive real-time alerts, and flow into your existing monitoring platform.
The Observability Event Stream
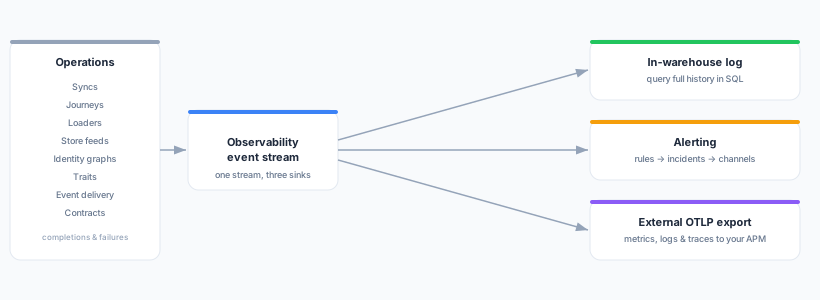
Every operational outcome becomes one observability event, capturing what happened, to which resource, whether it succeeded, and any relevant metrics (row counts, duration, rejected rows). Events are produced for:
- Sync runs (reverse ETL to destinations)
- Journey runs (orchestrations)
- Loader runs (inbound data pulls)
- Store feed refreshes
- Realtime audience snapshot rebuilds — both the workspace-wide rebuild as a whole and, separately, each audience it rebuilt
- Identity graph runs
- Trait evaluations
- Event delivery and contract activity from the Streams module
- Prepared table builds and data quality, where Data Prep is enabled for the workspace
- Anomalies found and resolved by anomaly monitoring, where it is enabled for the workspace (
anomaly.detected,anomaly.resolved)
Both completions and failures are recorded, including runs that stall and are later detected as failed, and signals for consecutive failures and automatic pausing.
Most resources produce one event per run. Realtime audiences produce two levels, because one snapshot rebuild rebuilds every realtime audience in the workspace from a single warehouse scan: one event for the rebuild as a whole (resource_type audience_snapshot, resource_id the workspace), and one for each audience it rebuilt (resource_type audience_snapshot, resource_id the audience, carrying that audience’s membership size and its enter/exit counts). Alert rules can be scoped to a single audience because of the second level, and they still see the rebuild-level events too: each rebuild event records the audiences it covered, so a rule naming an audience matches the rebuild that included it — see Realtime audience scope.
Prepared tables produce six events, and four of them have no equivalent anywhere else in the platform. A build reports prepared_build.completed or prepared_build.failed per table, not per build, because one build covers a chain of tables that feed each other and two of them routinely end differently — so a build in which one table failed and three succeeded produces exactly one failure. On top of those, a prepared table can be in bad states that no run outcome describes:
| Event | What it means | Was the build green? |
|---|---|---|
prepared_build.completed | This table was rebuilt successfully | Yes |
prepared_build.failed | This table’s build failed, was skipped behind a failed input, or never ran because the build died before reaching it | No |
prepared_table.tests_failed | The data tests found violating rows, so nothing was published — the table still holds what it held before | Yes: it did what it was asked to |
prepared_table.drift_detected | A reconcile found the incremental table no longer matches what a full rebuild would produce | Yes |
prepared_table.input_schema_changed | A build found a new column on one of this table’s inputs — a prompt to re-validate the recipe, not damage | Yes |
prepared_table.stale | The table’s inputs have been newer than its last build for longer than the window set on it | There was no build — that is the problem |
The last one is the only signal in the platform that reports the absence of work. Every other event rides on something that happened; a table whose builds quietly stopped produces nothing to ride on, so Zeotap goes looking for it instead. It is reported once per episode and clears when a build catches the table up. Every one of the six can be routed with an alert rule — see Prepared table scope.
The Three Sinks
In-Warehouse Log
Every observability event is written to a table in your own data warehouse, so you can query your complete pipeline history with plain SQL — join it against your other data, build dashboards in your BI tool, or run ad-hoc investigations. This is on by default. See In-Warehouse Log.
Alerting
The same event stream drives configurable alert rules. When a rule’s condition is breached, an incident opens and notifications are dispatched to your channels (Slack, email, or a webhook). Incidents recover automatically on the next clean run. See the Alerting section.
External Export (OTLP)
Export metrics, logs, and traces to any OpenTelemetry-compatible monitoring platform — New Relic, Datadog, Grafana Cloud, Honeycomb, or a generic OTLP collector — so Zeotap’s operational health sits alongside the rest of your infrastructure in the tools your team already uses. See External Export (OTLP).
Next Steps
- In-Warehouse Log — Query your pipeline history in SQL
- External Export (OTLP) — Send telemetry to your monitoring platform
- New Relic Setup — Step-by-step OTLP export to New Relic
- Anomaly Monitoring — Automatic detection and root-cause analysis of unusual drops and failure spikes
- Alerting — Rules, channels, and incidents