Anomaly Monitoring
Anomaly monitoring watches your workspace for activity that has fallen far outside its usual pattern — a sync that stopped completing runs, a journey whose runs started failing, an event that stopped arriving from your site, a forwarding rule whose deliveries dried up — and tells you about it with an analysis of the likely cause. You do not configure anything: Zeotap compares each resource with its own recent history.
Alert rules catch the problems you anticipated when you wrote them. Anomaly monitoring catches the ones nobody wrote a rule for, which usually fail quietly: every run that does happen succeeds, there are just far fewer of them, so no failure-based rule ever fires.
Prerequisites
- Anomaly monitoring enabled for your workspace. It is off by default; if you do not see Anomalies under Alerts in the left sidebar, ask your platform administrator to enable it.
- The
alerting.readpermission to view anomalies. Members withalerting.writealso receive the email digests.
How It Works
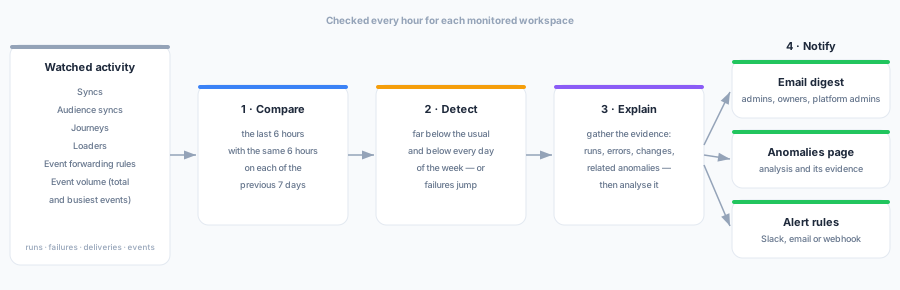
Every hour, Zeotap:
- Compares the last six hours of each resource’s activity with the same six hours on each of the previous seven days.
- Detects an anomaly when the activity is far below what that week predicts, or when failures jump against a history of clean runs.
- Explains each new anomaly: it gathers the evidence — the resource’s status, its recent runs and errors, recent configuration changes, other anomalies at the same time — and writes an analysis of the probable cause and what to do next.
- Notifies the people who can act on it, shows the anomaly on the Anomalies page, and hands it to any alert rule you have set up for anomalies.
What is watched
| Resource | What is measured |
|---|---|
| Syncs and audience syncs | Completed runs; the share of runs that failed |
| Journeys (orchestrations) | Completed runs; the share of runs that failed |
| Loaders | Completed runs; the share of runs that failed |
| Event forwarding rules | Events delivered; the share of deliveries that failed or were dead-lettered |
| Event volume | Events received by the workspace in total, and for each of its 20 busiest events |
Drafts are not watched. A resource you pause, archive or delete stops being watched — its silence is intentional — and any anomaly open on it closes. The same goes for an event that has not arrived at all in the last six hours or on any of the previous seven days: it has been retired, not dropped. A sync that Zeotap paused automatically after repeated failures is still watched, because that silence is exactly what you want to hear about.
How an anomaly is decided
Comparing with the same hours of previous days, rather than with the hours just before, is what stops a quiet night from reading as an outage: most activity in a CDP rises and falls through the day. Seven days means every weekday is included once.
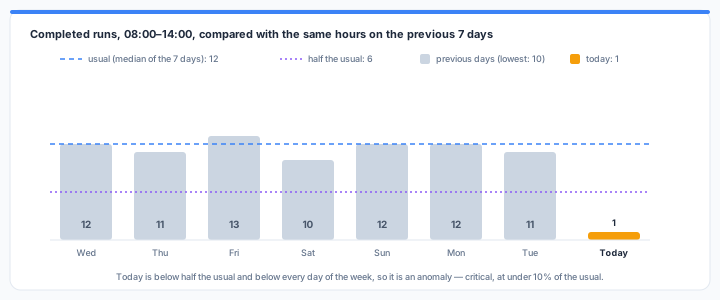
A drop in activity is an anomaly only when all of these are true:
- The resource is busy enough for a drop to mean something: at least 3 completed runs, 100 events or 50 deliveries in a typical six-hour window.
- It was active on at least 5 of the previous 7 days.
- The last six hours are below half the usual (the median of the seven days).
- They are also below every one of the seven days — a dip the resource has had before this week is not unusual.
It is critical when activity is at 10% of the usual or less, and a warning otherwise.
A failure spike is an anomaly when at least half of a resource’s runs failed in the window (at least three failed runs), or a quarter of a forwarding rule’s deliveries (at least 20), against a history in which failures were rare. A resource that has always failed often is broken rather than anomalous — use a Failure streak or Fatal error rule for that.
An anomaly stays open while the problem continues and is checked again every hour. It can escalate from warning to critical, but never back. It resolves when activity returns to at least half of what was usual when the anomaly was detected, when the failure rate falls well below the level that opened it, when you pause or delete the resource, or when you dismiss it.
These rules are deliberately cautious, so that an anomaly email is worth reading. As a result:
- Resources that run rarely are not judged. A weekly job, or a sync that runs only once or twice in six hours, never has enough history. Use a No recent run or Throughput stall rule for those.
- New resources are not judged for about a week, until they have enough active days.
- Only drops and failure spikes are detected. A sudden increase in event volume is not reported.
- Conversions API destinations count an event as delivered once it is queued for sending, so a conversions API rejecting events does not appear as a delivery failure spike. A drop in its deliveries is still detected.
Viewing Anomalies
Navigate to Alerts → Anomalies in the left sidebar. The list shows every anomaly found in the workspace, newest first, with its severity, the resource, what was measured and whether it is still open. Filter by Open or Resolved.
Click an anomaly to open its detail page:
- Observed, Usual, Change and the Window it was measured over.
- Compared with the past week — a chart of the seven previous days against the current window.
- Root-cause analysis — a short summary, up to three probable causes with a confidence level and the evidence behind each, and suggested next steps in the order to take them.
- Evidence — the facts the analysis was written from: the resource’s current state, its most frequent errors, recent runs, recent configuration changes to it and to what it depends on, other anomalies open at the same time, and — for a drop in event volume — which events fell.
The analysis appears a few moments after the anomaly is detected; the page updates on its own when it lands.
Configuration changes come from the workspace audit log, so they are shown only to members with the workspace_audit.read permission (owners and admins by default). Everyone else with access to anomalies sees the analysis and the rest of the evidence without them, and the analysis itself never names the person who made a change.
Dismissing an anomaly
Some changes are intentional — a sync you moved from every half hour to once a day will never “recover” to its old level. If you have the alerting.write permission, click Dismiss on the anomaly’s detail page to resolve it by hand. A dismissed anomaly shows as dismissed, and any alert incident on it recovers.
The analysis
The analysis is written by a language model that reads the evidence for a workspace’s new anomalies together, because several anomalies starting together usually share one cause — a warehouse, a destination, a tracking change — and saying so is the most useful thing it can do. It is instructed to cite the specific error, change or status behind each cause, and to say so plainly when the evidence does not explain the anomaly rather than guess.
When a language model is not available, Zeotap writes the analysis from rules over the same evidence instead, and the detail page says so. Either way, every anomaly is analysed, and the evidence it was written from is shown beneath it so you can check it. Treat the analysis as a strong starting point for your investigation, not as a verdict.
Investigating with Zeotap Agent
On an anomaly’s detail page, click Investigate with Zeotap Agent. This copies a prompt naming the anomaly and opens the agent panel; paste it into the chat. Zeotap Agent starts from the same evidence, then checks it against the run history, schema and warehouse, and tells you what to fix.
You can also simply ask Zeotap Agent why something stopped or dropped — it looks at recorded anomalies first. See MCP Server for the underlying tools.
Notifications
When new anomalies have been analysed, Zeotap sends one email digest per workspace, covering everything found in that check, to:
- Every workspace member with the
alerting.writepermission (owners and admins by default, plus any custom role that includes it). - The person who created each affected resource, if they are still a member of the workspace.
Your platform administrators receive a separate copy. A problem that affects several resources at once — for example, nine syncs failing on one warehouse — arrives as one email, not nine. Each item names the anomaly, the analysis summary, the most likely cause, the first next step, and links to its detail page. Web addresses that appear inside resource names or quoted error messages are shown in a non-clickable form (https[:]//…, www[.]…), so the only links in the email are Zeotap’s own.
You are emailed once per anomaly, when it is found — and not at all if it had already resolved by the time its analysis was written. No further email is sent while it stays open, when it escalates, or when it resolves. To be told about those — or to send anomalies to Slack or a webhook — use an alert rule.
Routing Anomalies with Alert Rules
The Anomaly detected trigger sends anomalies to any of your alert channels. It is available once anomaly monitoring is enabled for your workspace.
- Navigate to Alerts → Rules → Add Rule.
- Choose the resource type to watch: Any resource, Sync (model and audience syncs), Journey, Loader, Event forwarding, or Event stream (event volume — the workspace total and individual events). Leave the resource list empty to watch everything of that type, or name the resources you care about.
- Choose the Anomaly detected trigger. There is nothing to configure — the monitor has already decided what is unusual.
- Pick a severity and your channels, and save.
The rule opens an incident when an anomaly is found on a watched resource and recovers only when the anomaly is resolved — by the monitor, by someone dismissing it, or by monitoring being turned off — not on the next successful run. That matters here: the problem may be that a sync now runs a tenth as often as it used to, and each of those rare runs still succeeds.
Anomalies are also recorded in the observability event stream as anomaly.detected and anomaly.resolved events, so they appear in your in-warehouse log and your external export.
API
Anomalies are readable over the REST API with the alerting.read permission; dismissing needs alerting.write:
| Method | Endpoint | Description |
|---|---|---|
GET | /api/v1/workspaces/{id}/anomalies | List anomalies, newest first, with their analysis but without evidence. Optional query parameters: state (open or resolved), resource_type, resource_id, limit. The response also carries enabled, which says whether the workspace is being monitored. |
GET | /api/v1/workspaces/{id}/anomalies/{anomalyId} | One anomaly, with its analysis and evidence (configuration changes included only if you hold workspace_audit.read). |
POST | /api/v1/workspaces/{id}/anomalies/{anomalyId}/dismiss | Resolve an open anomaly by hand. Returns the anomaly; 409 if it is already resolved. |
{
  "enabled": true,
  "anomalies": [
    {
      "id": "…",
      "metric": "runs",
      "resource_type": "sync",
      "resource_name": "Customers to CRM",
      "direction": "drop",
      "severity": "critical",
      "state": "open",
      "observed": 0,
      "expected": 12,
      "baseline": [12, 11, 13, 10, 12, 12, 11],
      "rca": {
        "summary": "…",
        "probable_causes": [{ "cause": "…", "confidence": "high", "evidence": "…" }],
        "suggested_actions": ["…"]
      }
    }
  ]
}
metric is one of runs, failure_rate, event_volume, deliveries or delivery_failure_rate; for the two rates, observed, expected and each baseline value are fractions between 0 and 1. The workspace’s total event volume has resource_id *. A resolved anomaly carries a resolution: recovered, resource_inactive (the resource was paused or deleted, or the event retired), dismissed, or monitor_disabled (monitoring was turned off while it was open).
Enabling and Disabling
Anomaly monitoring is enabled per workspace by a platform administrator. Disabling it stops the hourly checks, the analyses and the emails, and resolves any anomaly still open (shown as resolved · monitoring off), so alert incidents on them recover. Anomalies found before it was disabled are never emailed later, even if monitoring is turned back on. Everything it already found stays visible on the Anomalies page. Resolved anomalies are kept for 90 days by default; open anomalies are kept until they resolve.
Next Steps
- Alerting Rules — Rules for the problems you can anticipate
- Observability — The event stream behind alerting and export
- MCP Server — The tools Zeotap Agent uses to investigate